About This Course
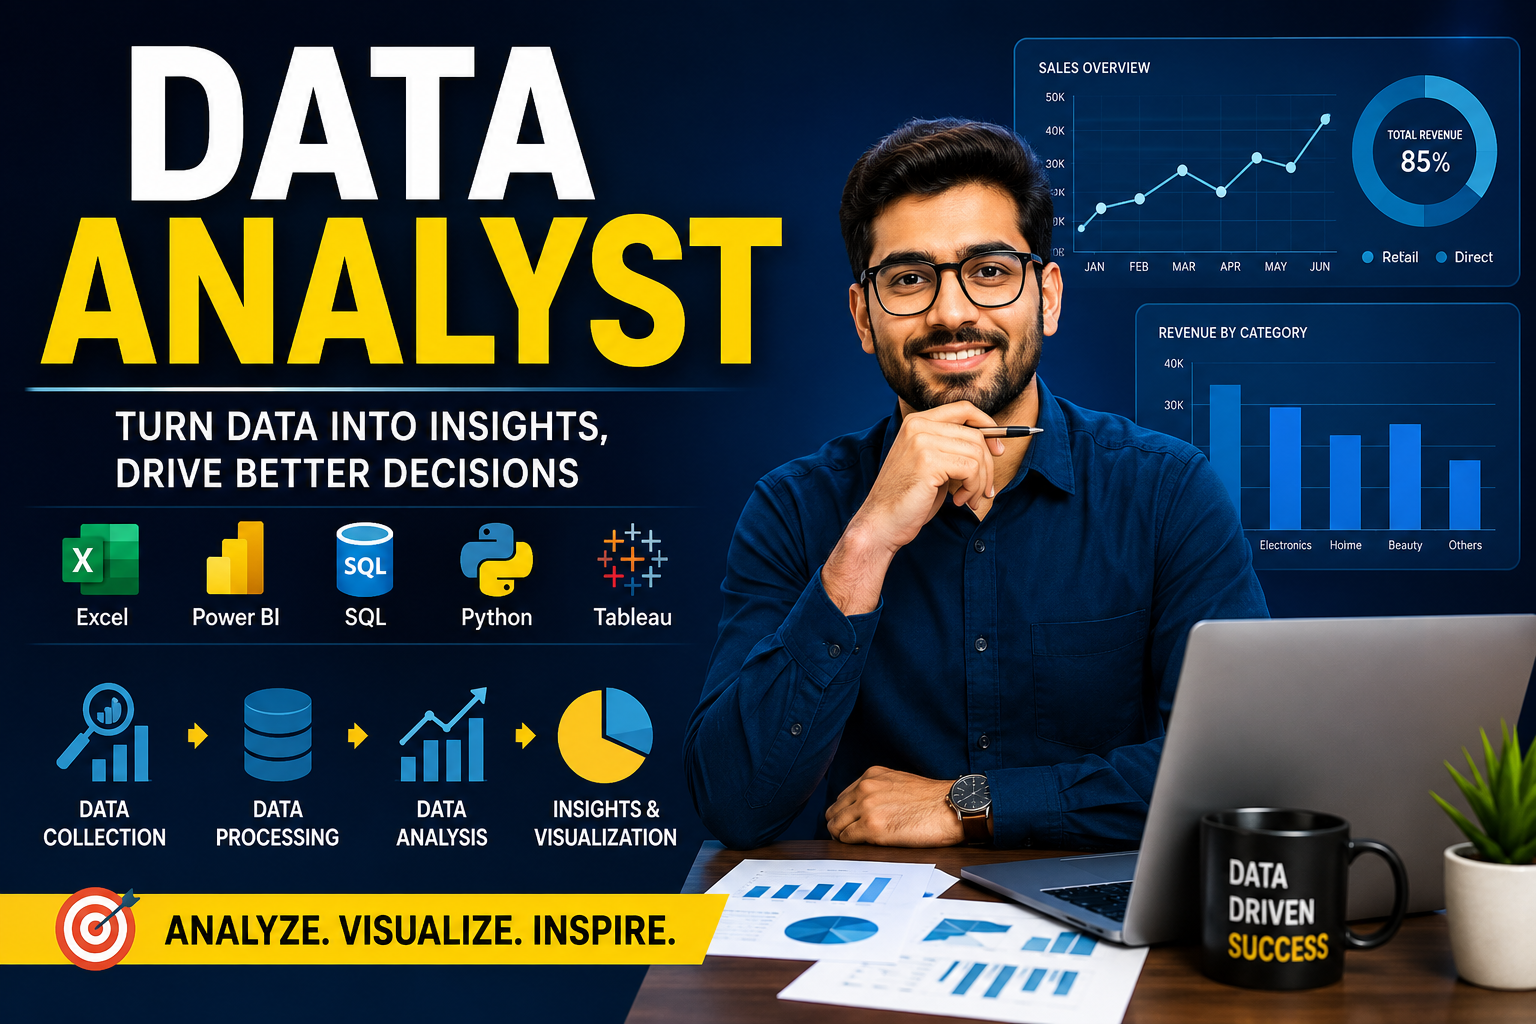
Become a job-ready Data Analyst by mastering the most in-demand tools and techniques used by leading companies worldwide. This comprehensive course is designed for beginners, students, and working professionals who want to build a successful career in data analytics.
You'll start by learning Microsoft Excel, including formulas, functions, Pivot Tables, charts, dashboards, and data cleaning techniques. Next, you'll master SQL using Oracle Database and MySQL to retrieve, filter, join, aggregate, and analyze data efficiently.
The course then introduces Python for Data Analysis, where you'll learn programming fundamentals, data manipulation, automation, and data visualization using industry-standard libraries. You'll also build interactive business intelligence dashboards using Power BI and Tableau, transforming raw data into meaningful insights for decision-making.
In addition to technical skills, you'll learn data cleaning, exploratory data analysis (EDA), statistics, reporting, KPI creation, dashboard design, and real-world business problem-solving. Throughout the course, you'll work on practical datasets and industry projects to gain hands-on experience.
Whether you're preparing for your first Data Analyst job, looking to switch careers, or aiming to improve your analytical skills, this course provides everything you need to become a confident and professional Data Analyst.
What you'll learn
Microsoft Excel from beginner to advanced
Data Cleaning and Data Preparation
Advanced Excel Functions and Formulas
Pivot Tables and Pivot Charts
Interactive Excel Dashboards
SQL using Oracle Database and MySQL
Data Retrieval and Analysis using SQL
Joins, Subqueries, Views, Window Functions, and Advanced SQL
Python Programming for Data Analysis
Working with Pandas and NumPy
Data Visualization using Matplotlib and Seaborn
Exploratory Data Analysis (EDA)
Business Reporting and KPI Analysis
Power BI Dashboard Development
Tableau Dashboard Development
Data Modeling and Data Transformation
Statistics for Data Analysis
Real-World Business Case Studies
End-to-End Data Analytics Projects
Interview Preparation and Resume Guidance
Who this course is for
Beginners with no programming experience
Students preparing for Data Analyst careers
Aspiring Business Analysts
MIS Executives
Reporting Analysts
Database Professionals
Software Engineers
Working Professionals looking to switch careers
Anyone interested in data analysis and business intelligence
Course Features
Beginner-friendly, step-by-step explanations
Hands-on exercises and real-world datasets
Industry-based case studies
Dashboard development using Power BI and Tableau
SQL and Python programming from scratch
Interview-focused questions and practical assignments
Lifetime access to course updates
Suitable for self-paced learning
By the end of this course, you'll have the practical skills to collect, clean, analyze, visualize, and present data using Excel, SQL, Python, Power BI, and Tableau. You'll be capable of building professional dashboards, generating actionable business insights, solving real-world analytics problems, and confidently applying for roles such as Data Analyst, Business Analyst, MIS Executive, Reporting Analyst, Business Intelligence Analyst, and Junior Data Scientist..